[Ops] k3s 환경에서 MIG 지원 GPU 모니터링 구축하기
DCGM Exporter → Prometheus → Grafana(Rancher Monitoring) 기반 GPU 모니터링 환경 구성
k3s 환경에서 MIG(Multi-Instance GPU) 를 포함한 GPU 모니터링 환경을 구축한 과정을 정리합니다.
구성 요소는 DCGM Exporter → Prometheus → Grafana(Rancher Monitoring) 으로 이어집니다.
배경
A100 GPU 서버에서 MIG 인스턴스를 활용해 여러 워크로드를 동시에 실행할 수 있습니다.
하지만 기본적인 nvidia-smi 모니터링만으로는 GPU/메모리 사용량을 장기적으로 추적하거나 k3s 클러스터 리소스와 통합 관리하기 어렵습니다.
따라서 Prometheus & Grafana 기반 모니터링 환경을 구성해 GPU 사용량을 시간 단위로 시각화할 수 있도록 했습니다.
환경
- k3s (containerd 기반)
- nvidia-device-plugin (GPU Operator 미사용)
- 단일 노드에서 MIG 인스턴스 + 전체 GPU 혼용
- Rancher Monitoring (Prometheus + Grafana)
목표: GPU/MIG 사용량 + 클러스터 메트릭을 통합 모니터링
구축 과정
1. dcgm-exporter 배포
GPU 메트릭 수집을 위해 NVIDIA에서 제공하는 dcgm-exporter DaemonSet을 배포합니다.
주요 설정은 다음과 같습니다:
runtimeClassName: nvidia또는nvidia.com/gpu리밋으로 NVML 주입privileged: true,/var/lib/kubelet/pod-resources마운트- 노드 라벨 기반
nodeSelector(예:gpu=nvidia)
1
2
3
4
# dcgm-exporter.yaml
apiVersion: apps/v1
kind: DaemonSet
...
2. ServiceMonitor 등록
Prometheus가 dcgm-exporter 메트릭을 수집하도록 ServiceMonitor 리소스를 추가합니다.
1
2
3
4
5
6
7
8
9
10
11
12
13
14
15
apiVersion: monitoring.coreos.com/v1
kind: ServiceMonitor
metadata:
  name: dcgm-exporter
  namespace: kube-system
spec:
  namespaceSelector:
    matchNames: ["kube-system"]
  selector:
    matchLabels:
      app.kubernetes.io/name: "dcgm-exporter"
      app.kubernetes.io/version: "4.4.0"
  endpoints:
    - port: metrics
      interval: 30s
3. Prometheus & Grafana 저장소 구성
장기적인 메트릭 보존을 위해 NAS 기반 PV/PVC를 연결했습니다.
예를 들어 Prometheus는 32GiB, Grafana는 10GiB 로 할당했습니다.
1
2
3
4
5
6
7
8
apiVersion: v1
kind: PersistentVolume
metadata:
  name: prometheus-pv-nas
spec:
  capacity:
    storage: 32Gi
  ...
rancher-monitoring Values에서 retention 정책도 지정합니다.
1
2
3
4
5
prometheus:
  prometheusSpec:
    retention: 15d
    retentionSize: "28GiB"
    walCompression: true
4. Grafana Ingress 구성
기본 Rancher UI 프록시를 통해 접속할 수도 있지만, 독립된 도메인으로 접근하고 싶어 Ingress를 추가했습니다.
1
2
3
4
5
# grafana.ini
[server]
domain = grafana.example.com
root_url = http://grafana.example.com
serve_from_sub_path = false
1
2
3
4
5
6
7
8
grafana:
  ingress:
    enabled: true
    ingressClassName: traefik
    hosts:
      - grafana.example.com
    path: /
    pathType: Prefix
5. 대시보드 설정
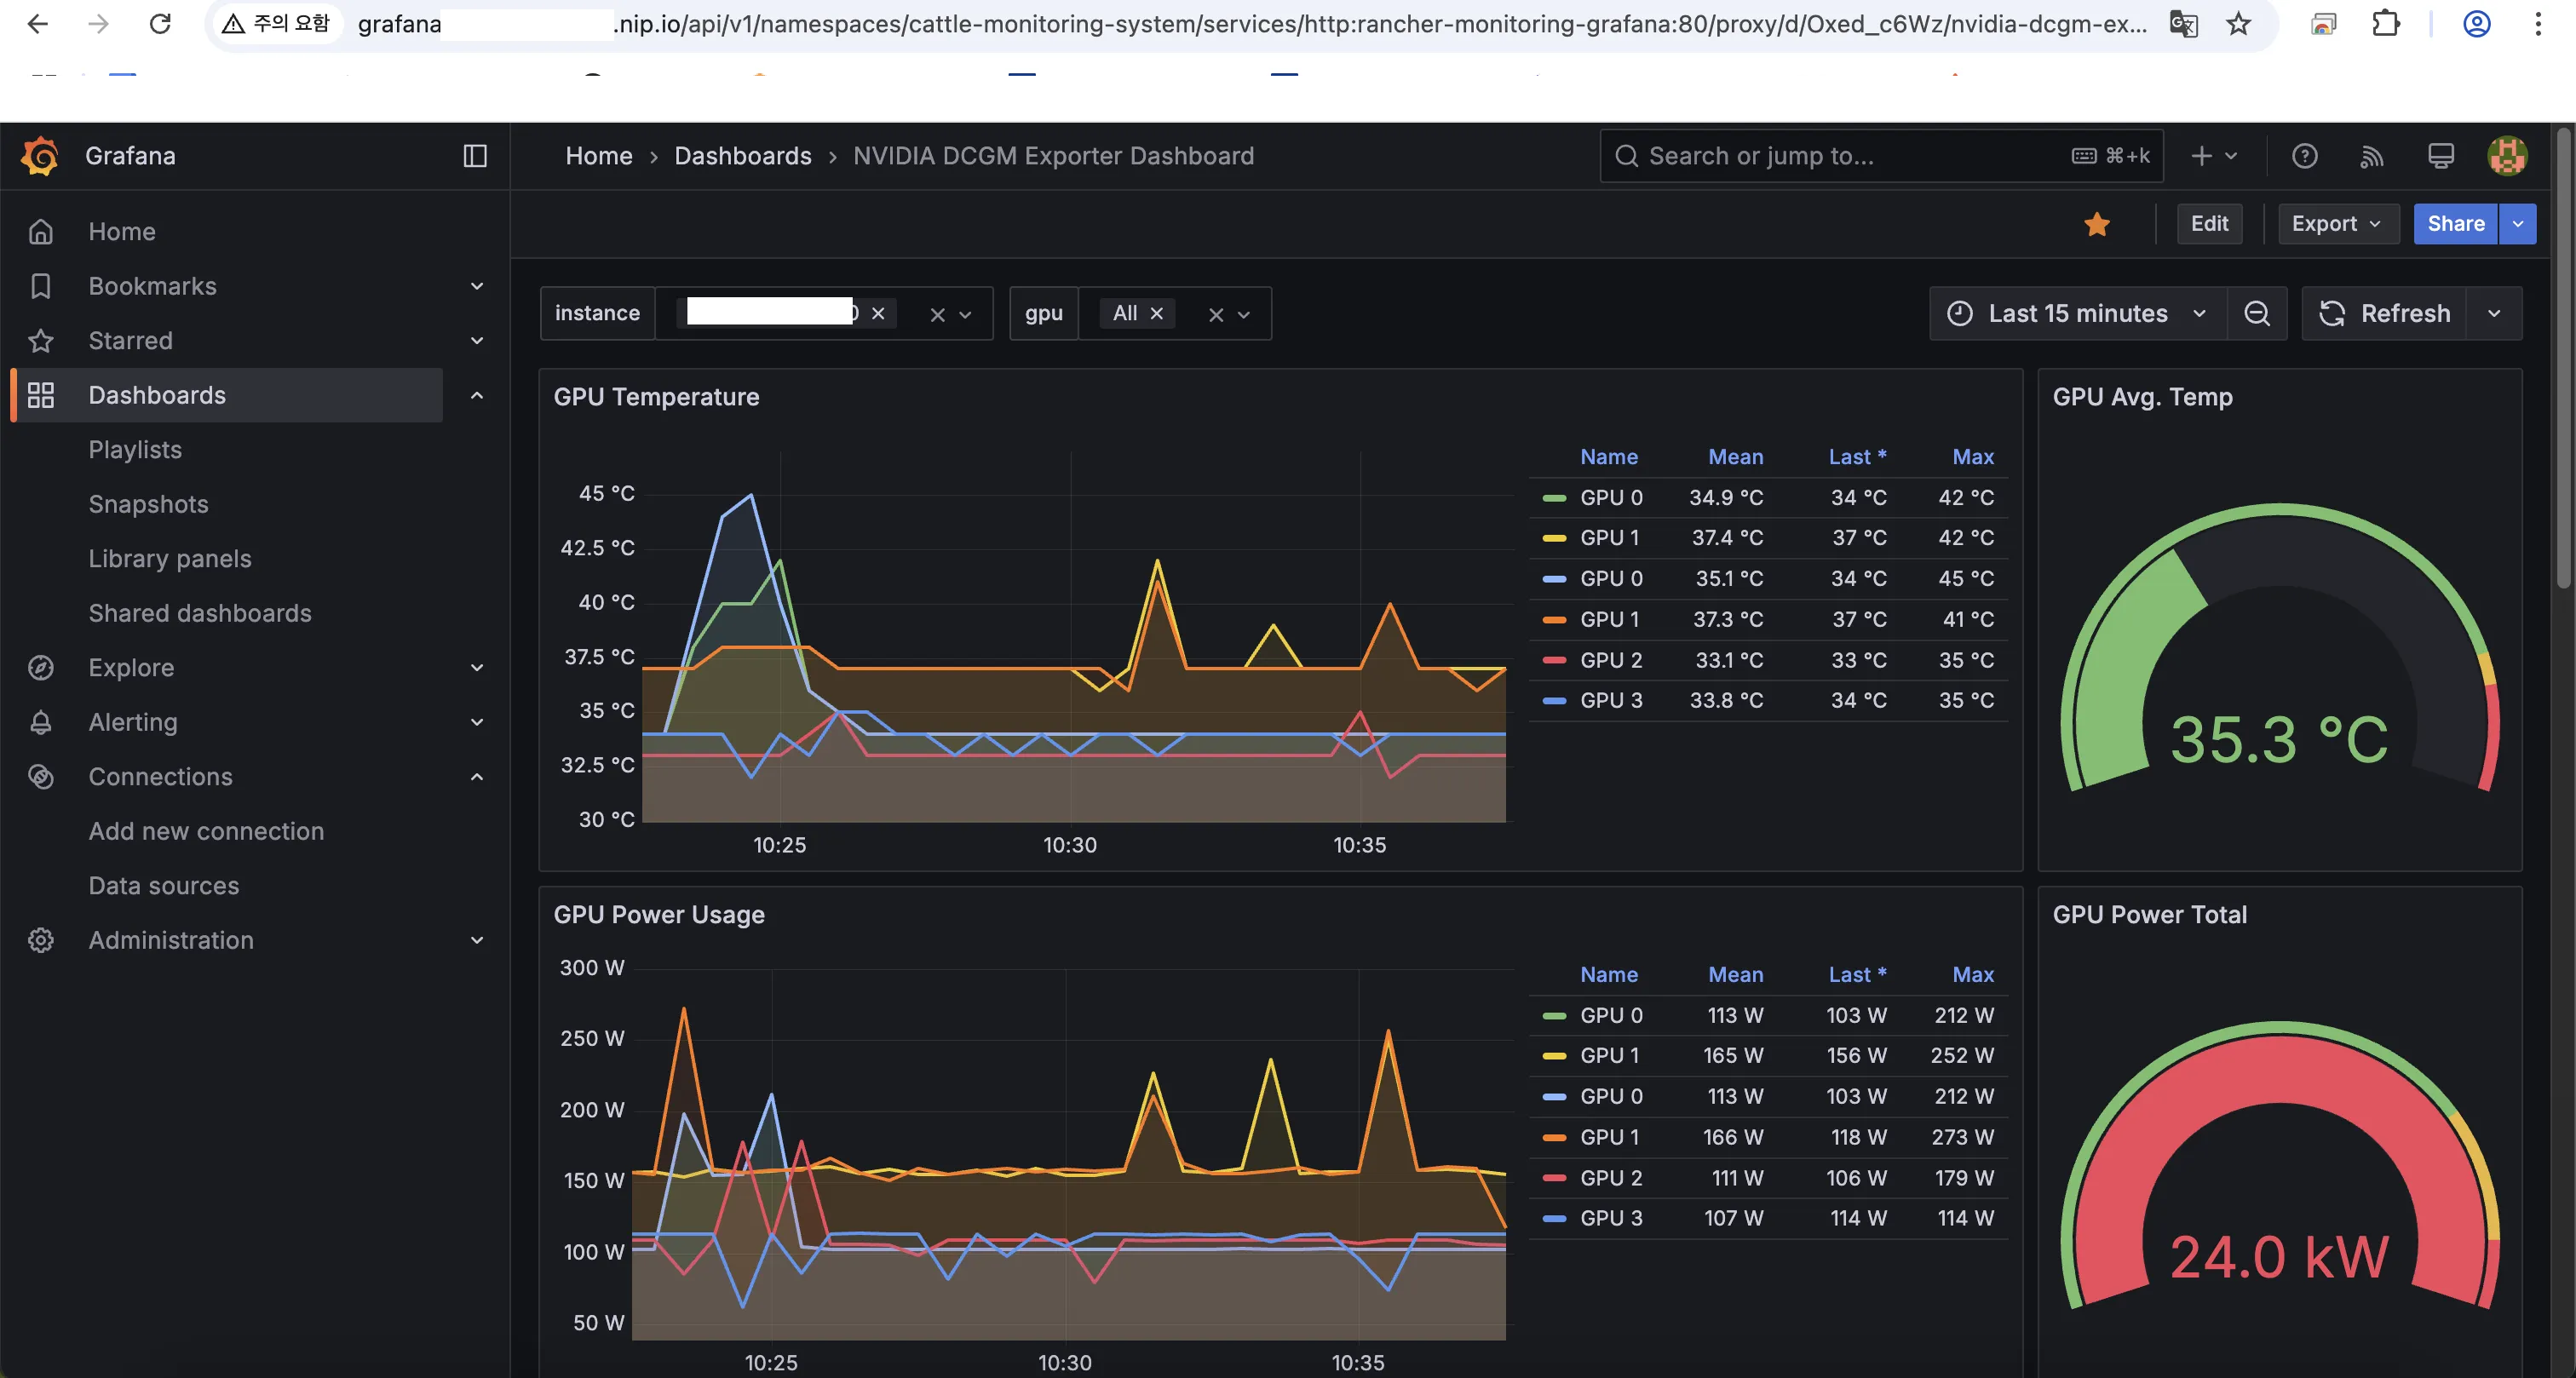
Grafana에 12239 GPU Exporter Dashboard를 임포트해 GPU/MIG 사용량을 시각화했습니다.
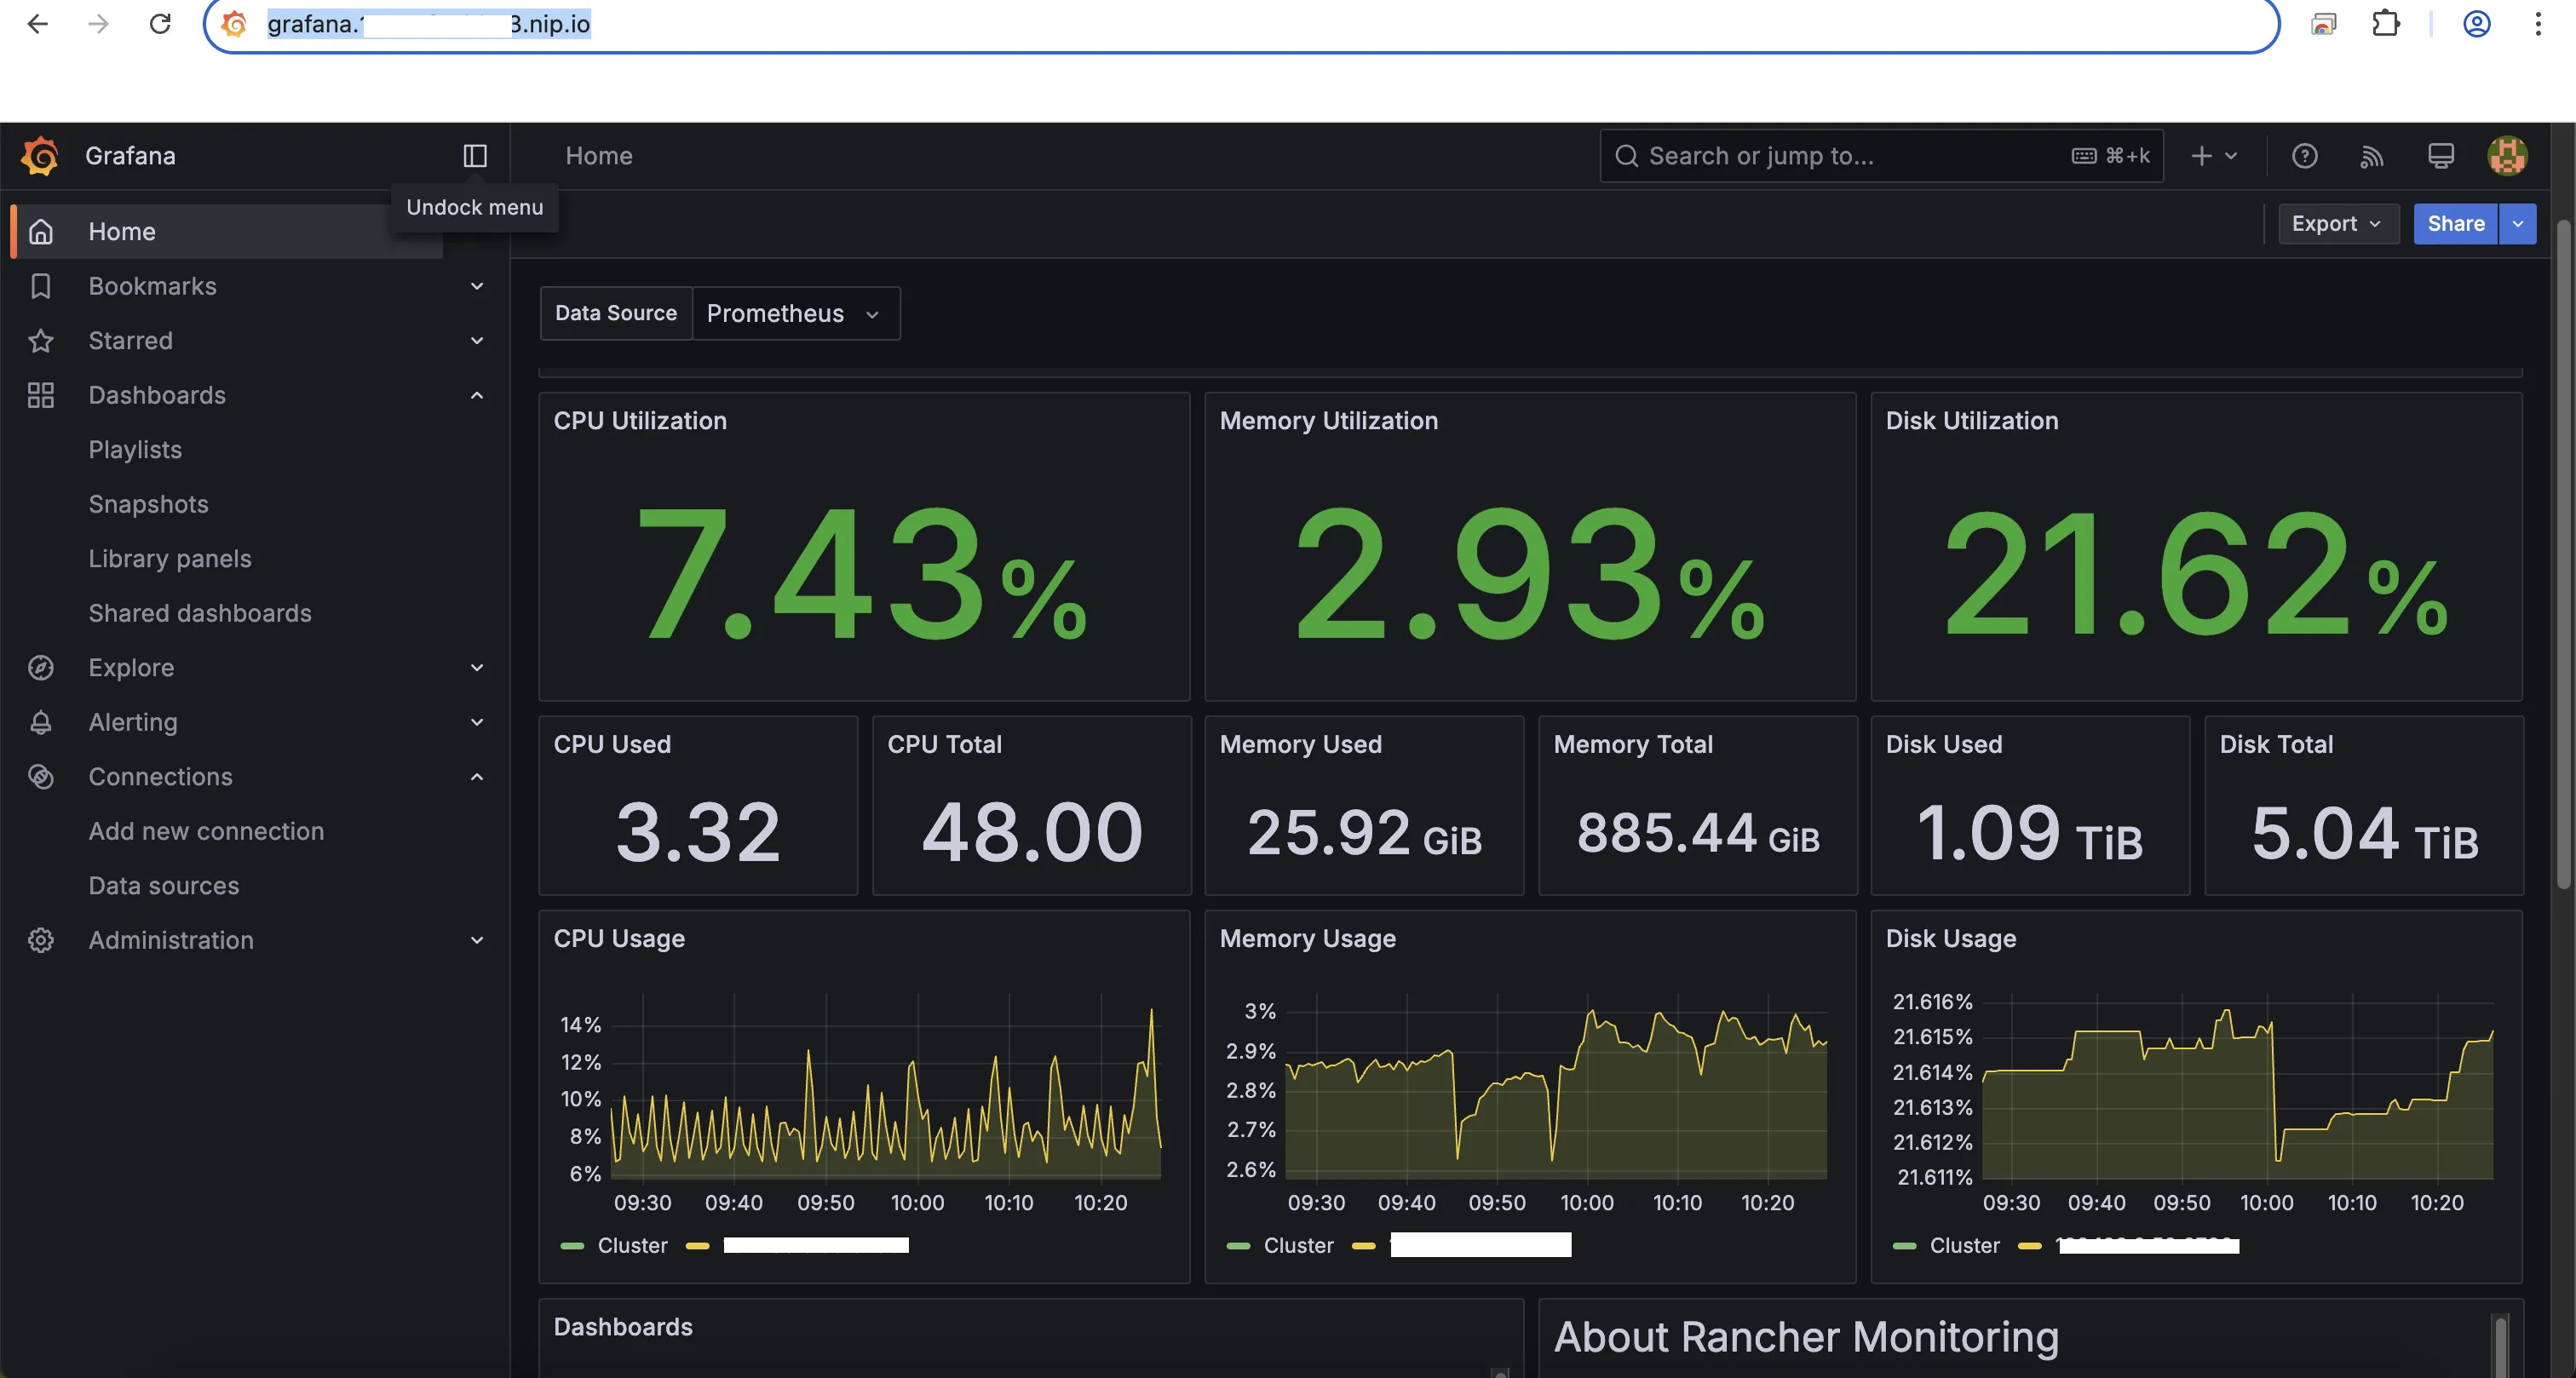
결과
GPU 및 MIG 인스턴스별 메모리/연산 사용량을 시간 단위로 확인할 수 있습니다.
클러스터 리소스 모니터링과 통합되어 관리가 한층 용이해졌습니다.
정리
- dcgm-exporter → Prometheus → Grafana 로 GPU 모니터링 체계를 구성
- PV/PVC로 스토리지 할당, 장기 보관 가능
- Rancher Monitoring 환경에 자연스럽게 통합
- MIG와 일반 GPU를 혼합 사용하는 환경에서도 GPU 자원 추적 가능
이 과정을 통해 GPU 활용 현황을 보다 체계적으로 관리할 수 있었으며, 추후 멀티 노드 확장 시에도 동일한 구조를 적용할 수 있습니다.